

Welcome to a series where i will be unpacking some of the most persistent assumptions shaping how Nigerian business leaders approach data collection. Many of these assumptions are rarely questioned, yet they quietly influence millions of naira in strategic decisions every year.
The first and perhaps most damaging assumption is this:
Accurate data should be expensive.
For most business leaders, the sheer size and chaos of Nigeria aren’t just intimidating; they are demoralizing. There is an existing multi-million Naira cost and a logistical nightmare of a “national survey,” the vast majority of businesses simply throw their hands up, abandon the search for data, and run on pure guesswork or stale reports. But what if the secret to conquering the Nigerian market isn’t about trying to map the entire ocean, but just knowing exactly where to take a spoonful?
In a country where 96% of businesses are SMEs (according to SMEDAN), the multi-million Naira cost of a traditional national survey is a barrier most cannot climb. Even the National Bureau of Statistics, the gold standard of our data, doesn’t visit every single stall in Nigeria; they rely on a strategic sampling of about 10,500 outlets to represent a nation of 200 million. If the giants are sampling, why are you still trying to guess? The constraint has never been the size of the market. The constraint has been the method.
The solution is not more data collection. It is smarter data collection.
At its core, data sampling is the statistical process of selecting a specific subset of individuals or observations from within a larger population to identify trends, patterns, and truths about the whole.
In a perfect world, a researcher should observe every single transaction in every corner of the country. But in a nation of over 200 million people and nearly a million square kilometers, a “total census” is a logistical and financial impossibility especially when the data you are chasing, such as food prices, changes by the hour.
So in this context think of sampling like this; a massive pot of Jollof rice being prepared for a 500-guest wedding. You don’t need to eat the entire pot to know if the seasoning is right. You take one spoonful. If that spoonful is balanced, you can confidently say the whole pot is a success. The spoonful should represent the entire pot so you make sure it is properly steered and structured in a way that the spoon you take should be representative so you don’t taste it and find out some parts are salty. In data collection, that spoonful is your sample.
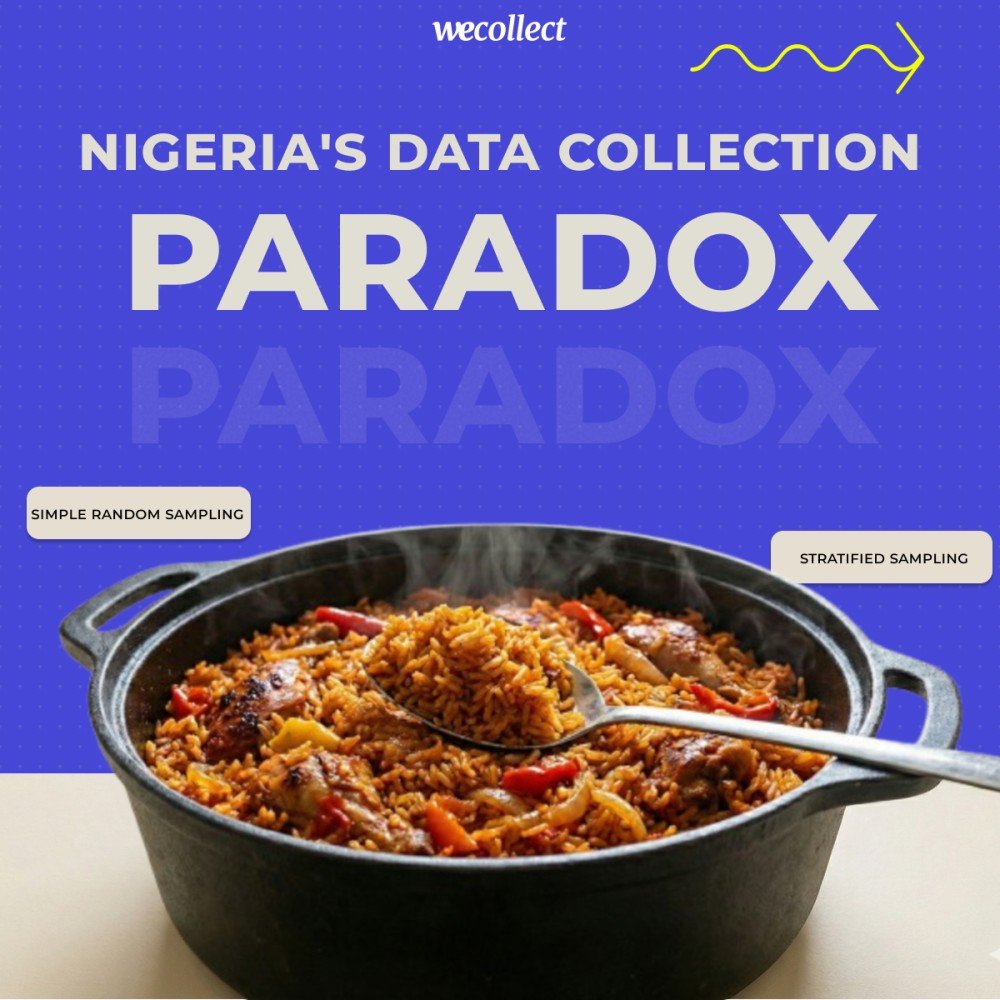
Here are 5 things to consider while trying to sample data, the context is for food prices because we know that a data point like food price should be collected at scale and in time.
1. Defining Your “Population” vs. Your “Sample”
Before you pick a single person to interview, you must clearly define who your “Total Population” is. Are you trying to understand every person in Nigeria, or just mothers in Lagos who shop at open-air markets?
The Population is the entire group you want to draw conclusions about, while the Sample is the specific group of individuals you will collect data from. If your population is “Rice Farmers in the North,” but your sample includes “Urban Grain Sellers,” your data will be skewed. A successful survey starts with a narrow, precise definition of who counts as a “spoonful” of your pot of Jollof.
2. Letting the Survey Type Drive the Sampling Strategy
One of the biggest mistakes businesses make is using a “one-size-fits-all” approach to sampling. In reality, the nature of what you are trying to learn should dictate exactly how you pick your spoonful. If you use the wrong method for the wrong goal, you’ll end up with precise answers to the wrong questions.
At WeCollect, we categorize surveys into two main “vibes,” each requiring a completely different sampling DNA:
- The Pulse Check (Descriptive Surveys): If you want to know the current state of food prices across Nigeria to set your weekly procurement budget, you need a Broad, Stratified Sample. This ensures you’re hitting enough diverse markets (rural vs. urban, North vs. South) to get a statistically accurate “snapshot” of the nation’s wallet.
- The Deep Dive (Explanatory/Causal Surveys): If you are trying to figure out why a specific brand of flour isn’t selling in the South-East despite a price drop, you need a Purposive or Cluster Sample. Here, you don’t need the whole country; you need to zoom in intensely on specific neighborhoods, bakeries, and retail kiosks in that region to find the “hidden” human story.
By aligning the survey’s “What” with the sampling’s “How,” we ensure that your data isn’t just a collection of numbers, but a direct response to your business’s most urgent needs. In the Nigerian data space, winning isn’t just about collecting data—it’s about knowing which tool to pull from the belt for the job at hand.
3. Choosing the Right Sampling Method (Random vs. Stratified)
How you pick your participants is just as important as who they are. There are two main paths:
- Simple Random Sampling: Every person in the population has an equal chance of being picked. This is like pulling names out of a hat. While fair, it often misses the “pockets” of specific data in a complex country like Nigeria.
- Stratified Sampling: This is the “Secret Sauce” for accuracy. You divide your population into subgroups (strata) based on characteristics like geography, income, or age. For example, you ensure you have a set number of samples from rural Benue and urban Port Harcourt. This ensures that a single dominant group (like Lagosians) doesn’t drown out the voices of the rest of the country.
4. Calculating the Margin of Error and Confidence Level
In the world of data, there is no such thing as 100% certainty. You must decide how much “wiggle room” your business can afford.
- Confidence Level: This tells you how sure you are that your sample reflects the whole population (usually 95%).
- Margin of Error: This is the range of “plus or minus” in your results. For instance, if you find that the price of beans is ₦1,000 with a 5% margin of error, the real price likely sits between ₦950 and ₦1,050.
A smaller margin of error requires a much larger (and more expensive) sample size. You have to find the “sweet spot” where the data is accurate enough to make a decision without spending more than the insight is worth.
5. Geographic and Seasonal Weighting
Nigeria’s markets don’t operate in a vacuum; they are dictated by geography and the calendar. When sampling, you must consider Weighting.
If you collect data during the rainy season, transport costs are higher, and certain crops are scarce. If you sample heavily in January but don’t account for the “harvest glut” in October, your year-end projections will be wrong. Similarly, you must weight your data based on market volume. A price shift in a major hub like Onitsha is “heavier” and affects more people than a price shift in a tiny village. Your sample must reflect these power dynamics to give you a true picture of the economy.
Mastering the art of the sample is more than a technical requirement; it is a strategic shield against the unpredictability of the Nigerian market. By focusing on the “right” spoonful rather than the entire pot, your business gains the clarity to move with confidence while others are paralyzed by the noise of inaccurate data. But as any market veteran knows, having the right map is only half the battle—you also need to move fast enough to use it.
Are you ready to stop guessing?
Make a data request: https://www.wecollect.tech/request or schedule a demo to see how we make it work https://demo.wecollect.tech/
